Downtown is expensive, and more in weekends and summer time: an analysis of AirBnB data in Seattle

That should not be surprising. In the U.S., more travels over the summer, more historical sites and festivals in the downtown, so if listing price is higher when demand is peak, that is how the market works.
With periodical scraped data by insideairbnb.com, an independent and non-commercial website, we could have a closer look of listing location, current price, advance price marking, reviews data, even to build a predictive model on pricing.
- How listing price looks like on AirBnB in Seattle?
Seattle is not a low-cost option. The average listing price was around $180 a night for all neighborhoods in Seattle. The price distribution is right-skewed or a long-tail to a higher price. The graph below is cut-off at $2000 but there is a listing of $9999. That means spending upward $200 to $300 per night is ensured you to have a nice place in Downtown area. Notice that some host requires certain minimum nights. Please note there is other fees on top of the listing price such as cleaning fee, service fee, extra people plus tax.

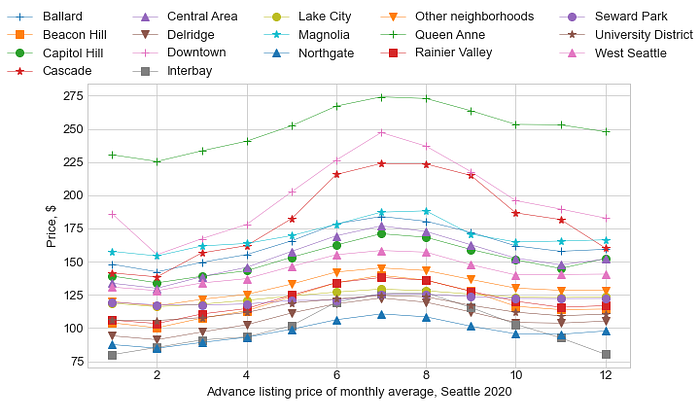
Using an average listing price and comparing across a large area bears some uncertainty, mostly the variation between locations, the number of rooms, the number of beds per room, amenities, host history and reviews. With data given, the itemized price is shown in the graph below as dollars per room in different neighborhoods. The Downtown area is clearly more expensive where the Space Needle, Pike Place Market, Chinatown — International District to named a few in a short distance. But if you are on budget, you can stay a bit further from downtown areas and the listing price of $100 or lower such as Central Area is another option.

Note that the graph above is a snapshot of price on January 20, 2020. If you are planning to visit Seattle one day, you may wonder the price change during the week days and weekends or even between each month. I divulged in the title, but let see how we can substantiate that assertion.
2. What is price trend in the week and over the year?
The dateset contains an advance marking price called calendar of each listing. First let a look at the price change during weekdays and weekends.

If you plan to say in Queen Anne or other close to downtown neighborhoods, it would not matter that much the price difference between days in week. However, if you want to maximize the experience in Seattle and fit your quick weekend trip, booking for a place on Friday and Saturday is slight higher than other day. The variation is low staying below 5% compared to average price.
The calendar file listed one-year price in advance which is perfect the see the planning price for the next year, in our case from January 2020 to January 2021.
And sure enough, the price is higher in June to August than other months. The magnitude change is pronounced between Downtown and Cascade and the rest of Seattle neighborhood. Let have close look at two graphs below.
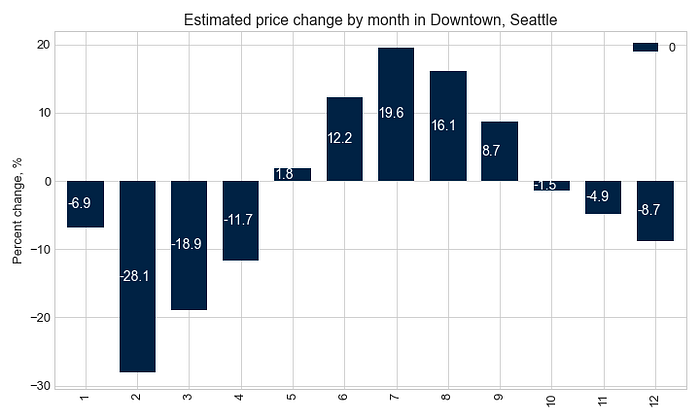
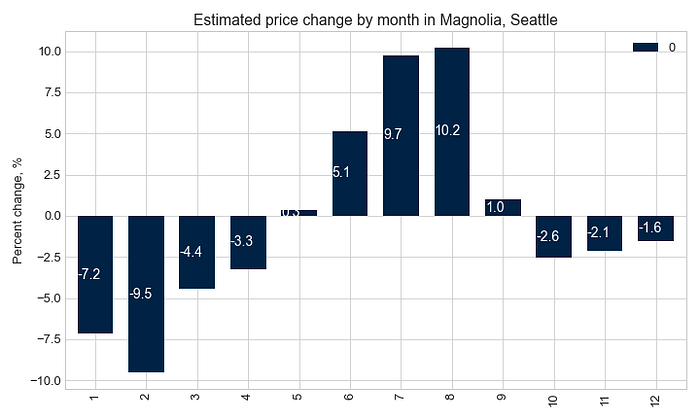
The pattern is the same between Downtown and Magnolia, a higher price during summer time and lower during early spring compared the yearly average. The distinct different is the price variation of -28% in February to +20% in July per nightly stay in Downtown. That change in nearby location such as Magnolia is -10% and +10% between the valley and peak demand. So if you don’t mind to travel rainy and possible snowy time, and really experience a real Seattle, travelling on February is not totally horrible idea, especially on money spending for lodging.
3. Could we apply a predictive model for the price?
With lots of data, many rows and columns, we get lost quickly. This dataset on AirBnB is over 8000 rows and 100 columns and missing values in between. A few columns contains one dominant value that is not informative to make any prediction. The simple answer is yes, but how well the prediction is?
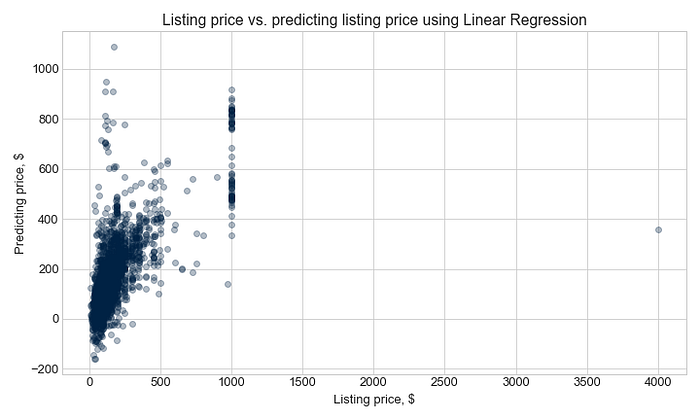
Not much. A negative price is predicted! From the graph, we see a large number of listing with $1000 tag. This make the price looks “pretty” but harder for any fitting model to draw out mechanical correlation with price. From question 1 above, the price listing show a long-tail to a higher price with extraordinary features. The data can be cleaned up by removing the outliers. on price.
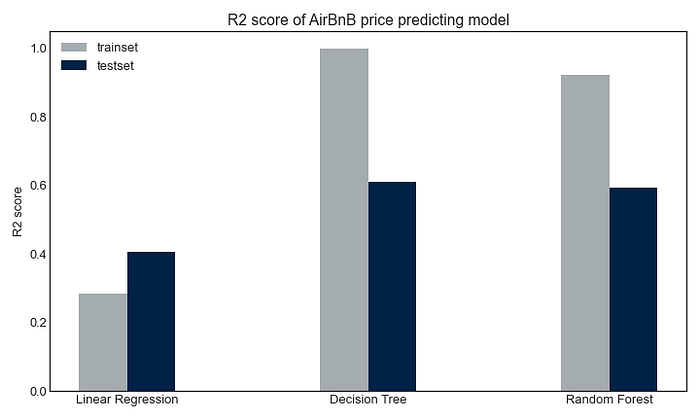
Using different fitting models in sklearn library, we could archive a higher correlation measured R2 score, but the Random Forest model, for example, over-fitted this data. In a simple term, the model predicts well by “remembering” the features in training dateset but lack of generalization with “unseen” dataset, which in the end, making the trained model less powerful to predict price on a new dataset.
In summary, if you like to visit Seattle with sunshine and stay in Downtown, a +10 to +20% high price is expected during June to August plus a few percent more during Friday and Saturday with a price tag of $200–$300. If you on budget travel, there are plenty of place for $100 or lower price. Predicting price using machine learning can be improved by reducing outliers on price and reduce duplicated features on the dataset.
For more information on how I analyzed this data set, check out the Jupyter notebook on GitHub.
